6 Jun 2026
Biomechanical Sensors Reshape Precision in Live Show Jumping Markets
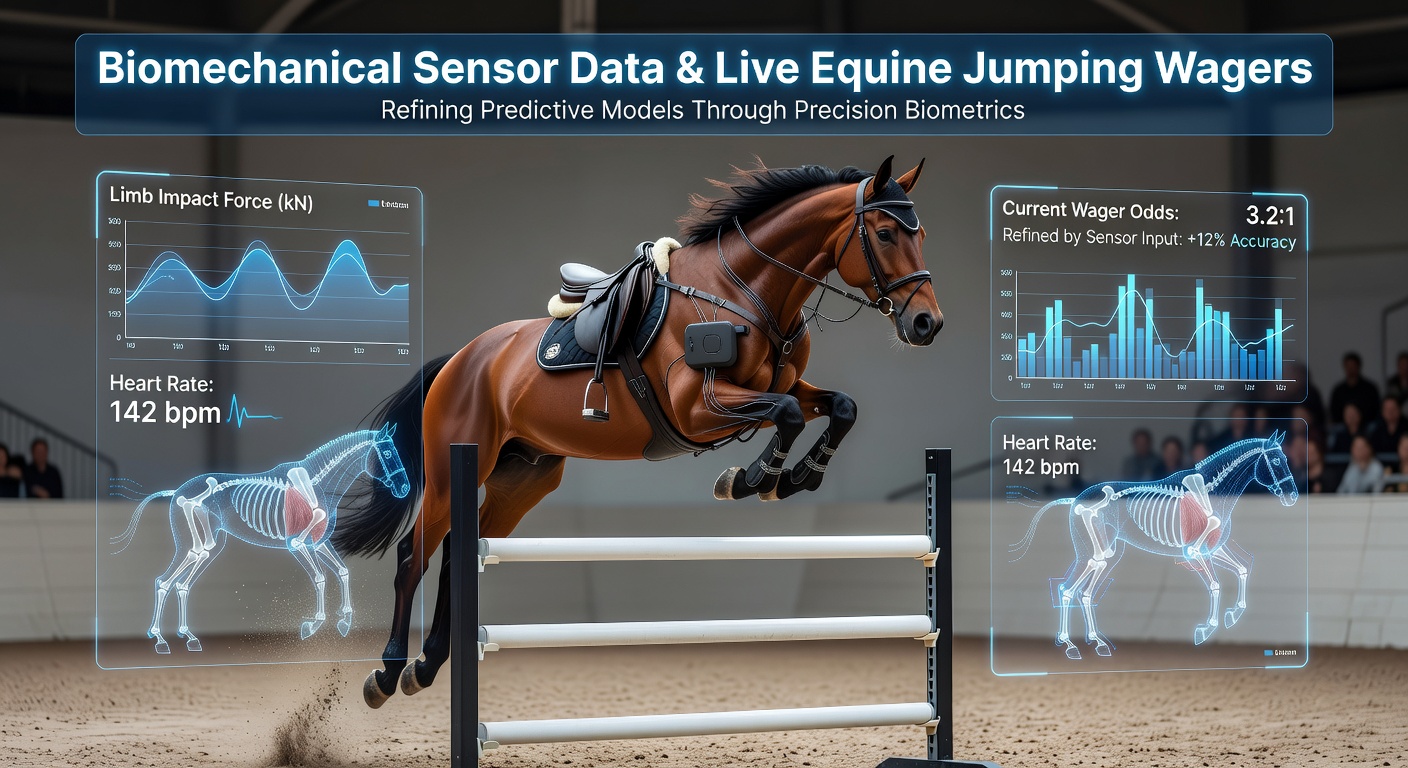
Equine jumping competitions generate vast amounts of performance data, and biomechanical sensors now capture detailed metrics on stride length, takeoff angles, and landing forces that influence live wagering decisions during events. These devices attach to saddles, leg wraps, and bridles, transmitting information through wireless networks to analysts and platforms that adjust odds dynamically as rounds progress. Data streams include acceleration patterns, joint flexion measurements, and heart rate variability, all recorded at frequencies exceeding 100 hertz for each horse in competition.
Core Components of Equine Sensor Systems
Modern systems combine inertial measurement units with pressure-sensitive insoles and GPS modules that track position relative to obstacles, while force plates embedded in competition surfaces provide ground reaction data that complements wearable readings. Researchers at veterinary universities have documented how these combined inputs reveal fatigue indicators minutes before visible signs appear, allowing markets to reflect subtle shifts in probability during multi-round classes. In June 2026 several international circuits plan expanded sensor trials that integrate video synchronization, giving bettors access to layered visualizations of each fence approach.
Integration with Live Wagering Platforms
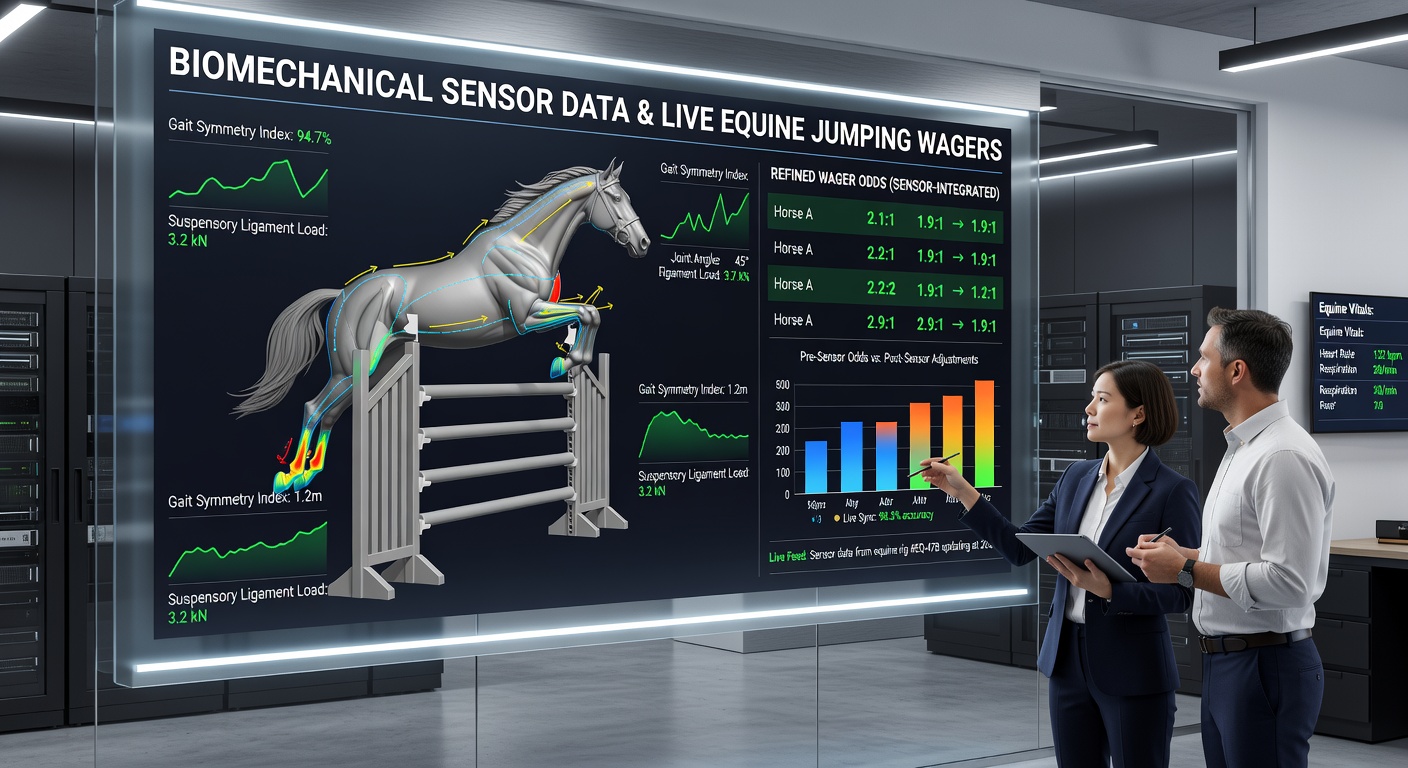
Betting operators receive anonymized sensor feeds through licensed data partnerships, then overlay the information onto existing odds engines that recalculate probabilities after every completed jump. A horse showing reduced hindquarter extension on early fences might trigger automatic adjustments in later-round markets, whereas consistent takeoff velocities can stabilize or strengthen implied chances. Observers note that platforms handling major events now process these streams within seconds, creating micro-markets on individual obstacles that did not exist before sensor adoption became widespread.
Performance Patterns Revealed by Sensor Arrays
Studies from equine research centers demonstrate that successful jumpers maintain specific ratios between vertical impulse and horizontal velocity, ratios that sensors quantify precisely across different course designs. One dataset collected during European indoor circuits showed that horses clearing 1.50-meter fences with takeoff angles above 22 degrees completed rounds with fewer faults when stride frequency remained below 2.1 strides per second on approach. These thresholds appear consistently in aggregated results, though individual variation depends on breed, training history, and surface conditions.
Additional metrics such as fetlock extension range and wither oscillation amplitude further refine predictions, particularly when courses include combinations that demand rapid recovery between fences. Analysts cross-reference these values against historical performance files to identify horses whose current sensor profiles diverge from established baselines.
Regulatory and Data Governance Considerations
International federations require explicit consent from owners before sensor data enters commercial betting streams, and several national authorities mandate independent audits of data transmission security. A report issued by the Australian Racing Integrity Board in early 2026 outlined protocols for encrypting live feeds and limiting retention periods to prevent unauthorized pattern exploitation. Similar frameworks operate in North American jurisdictions where state racing commissions review sensor partnerships annually to ensure market fairness.
Case Examples from Recent Circuits
During a major Canadian event series, one research team tracked 47 horses across three days and found that animals whose sensor profiles indicated early forelimb loading asymmetry recorded fault rates 18 percent higher than symmetric peers in subsequent rounds. Platforms adjusted live odds accordingly once the pattern emerged after the first day of competition. Another instance involved a European championship where sensor data flagged elevated landing forces on a specific horse, prompting market recalibrations that aligned closely with observed outcomes in later classes.
Future Developments and Standardization Efforts
Industry groups continue to develop uniform data formats so that readings from different manufacturers integrate seamlessly into betting systems worldwide. Work on standardized ontologies for equine kinematics began in 2025 and is scheduled for initial testing phases through mid-2026, potentially allowing smaller circuits to adopt the same analytical tools used at elite levels. Universities in both hemispheres contribute to these efforts by publishing open datasets that establish baseline values across various horse populations and competition types.
Conclusion
Biomechanical sensor networks supply measurable inputs that platforms incorporate into live equine jumping markets, creating more granular probability assessments based on stride dynamics and force distribution. Regulatory bodies across multiple regions maintain oversight of data handling, while ongoing standardization projects aim to broaden access and consistency. As sensor density increases and synchronization with video improves, the volume of usable performance indicators continues to expand, supporting refined decision frameworks for participants in these specialized wagering environments.